Earthlytix turns satellite archives, from 1960s reconnaissance film to today's constellations, into georeferenced, analysis-ready maps. We measure how cities grew, forests fell and coastlines moved.
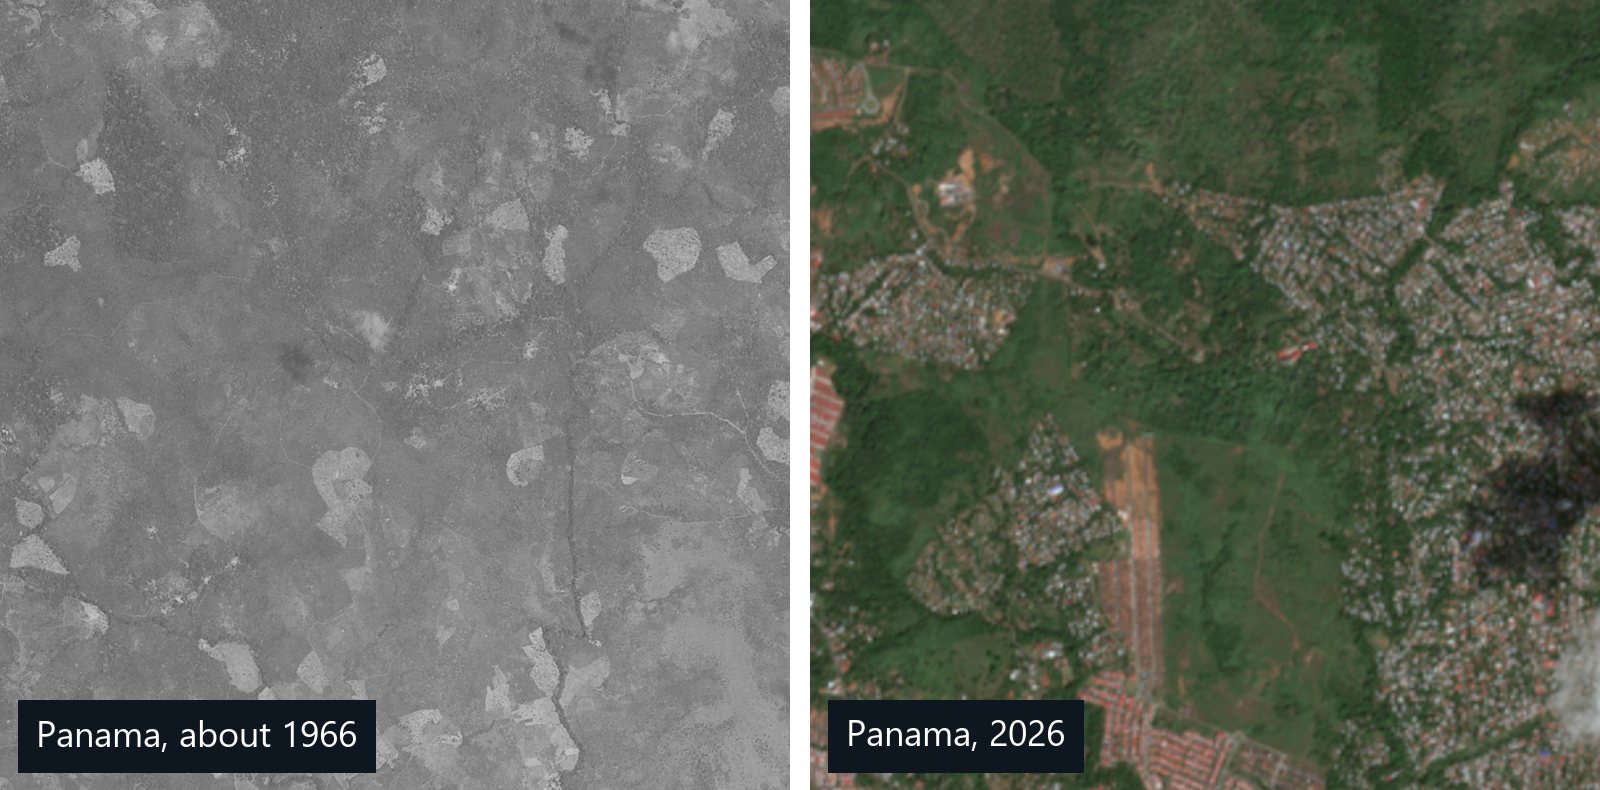
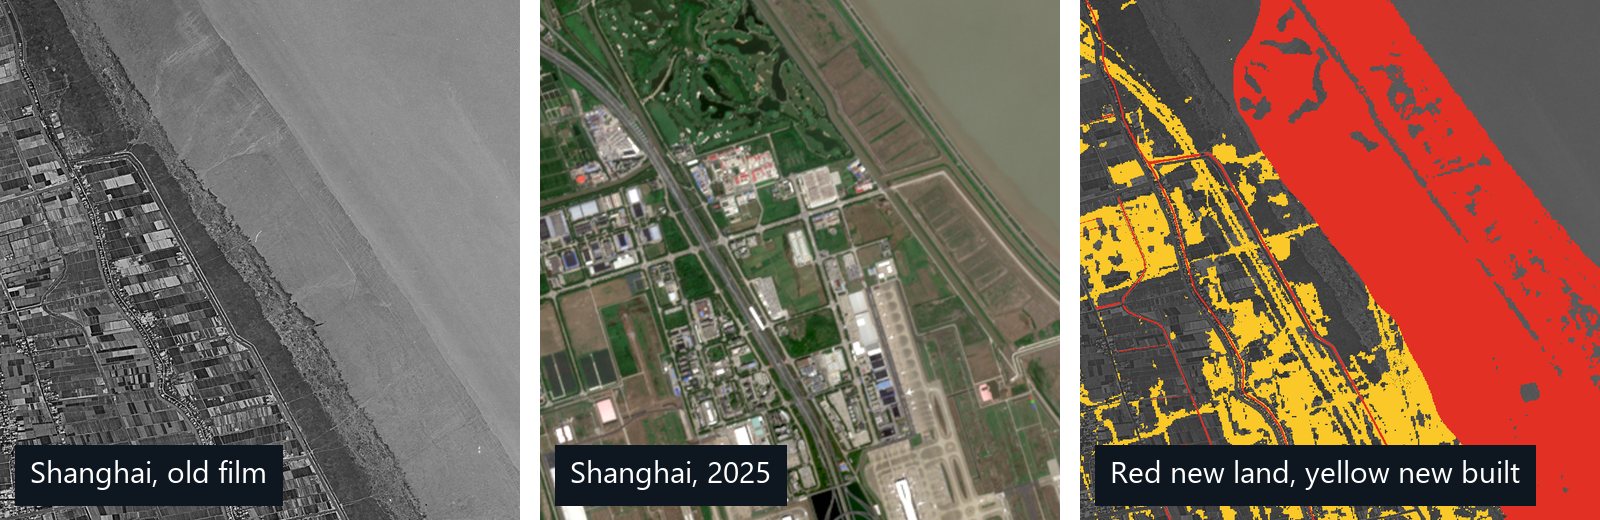
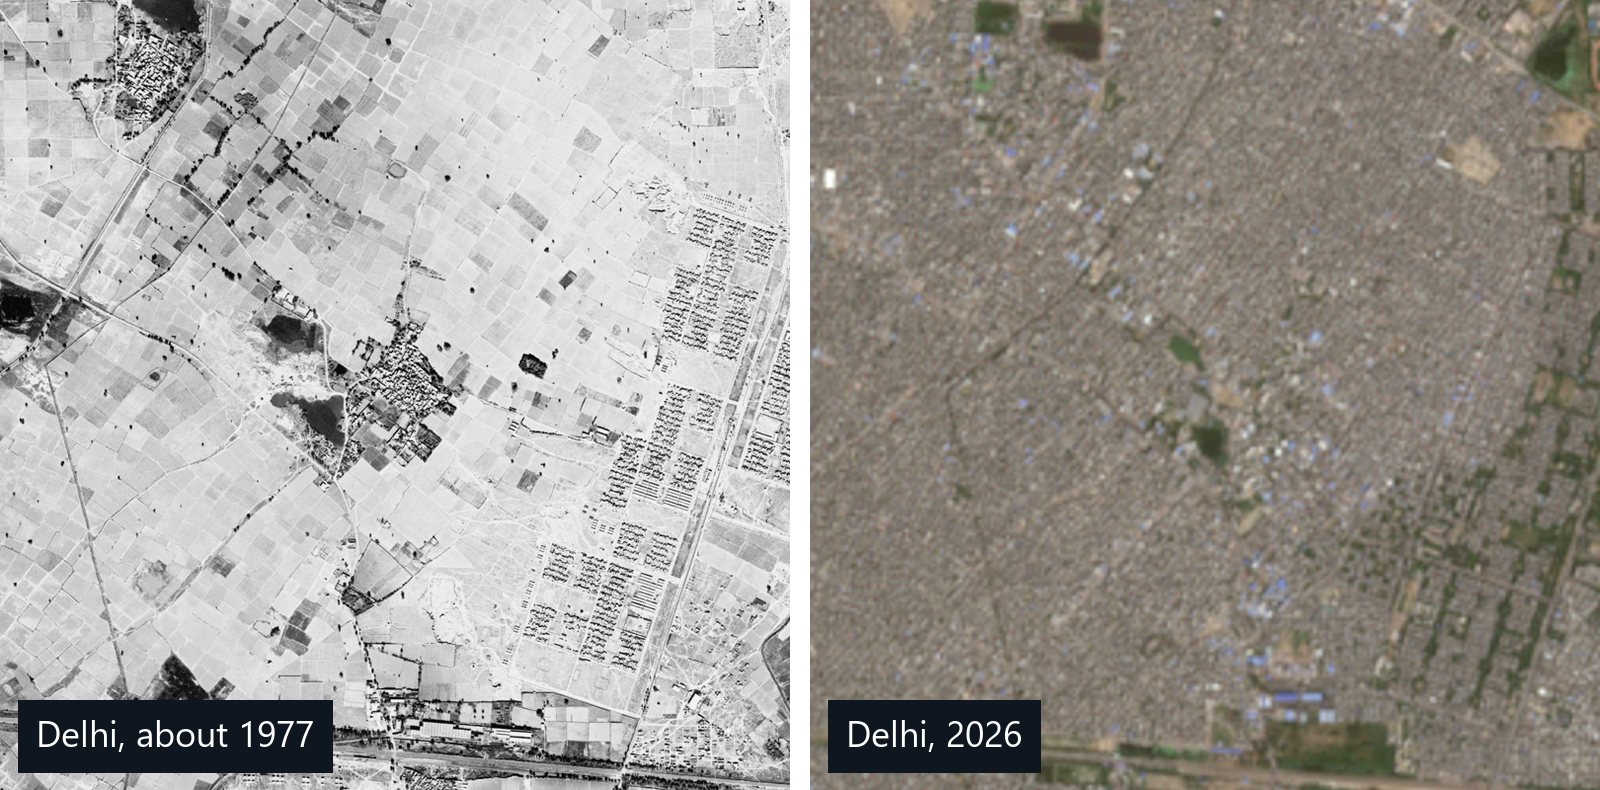
Each map pairs declassified film from the Cold War with today's high-resolution satellite imagery. Drag the handle to compare, then pan and zoom anywhere in the scene.
Historical imagery: U.S. Geological Survey declassified archive, shown at reduced resolution. Top-of-page preview: contains modified Copernicus Sentinel data 2026.
The archive
Decades of imagery, stitched into one record.
Most satellite analytics begin with recent imagery. We go back to the first satellite photographs of the Earth, then harmonise every era that followed so you can compare like with like.
1960s – 1980s
Reconnaissance film
Declassified Cold-War missions such as CORONA, GAMBIT and HEXAGON captured detailed imagery decades before commercial satellites existed.
1972 →
Landsat record
The longest continuous multispectral archive. It is the backbone for land-cover trends across half a century.
1999 →
Very-high resolution
Sub-metre commercial imagery for individual buildings, roads, plots and infrastructure.
2015 → today
Sentinel & constellations
Frequent revisits for current conditions, ongoing monitoring and near-real-time alerts.
How it works
From film canister to change map.
Historical imagery is hard to use. It is distorted, uncalibrated and unreferenced. Our pipeline handles that so you get clean answers, not raw pixels.
Source
We search every relevant archive for the best scenes covering your area and dates.
Rectify
Film is scanned, corrected for camera and terrain distortion, then co-registered to modern imagery.
Classify
Machine-learning models map land cover consistently across sensors and decades.
Quantify
Change is mapped and measured: hectares cleared, area built, shoreline moved, rate per decade.
Solutions
What we map, and what you get.
01 / URBAN EXPANSION
See how cities grew, decade by decade.
We map built-up extent for every available year, from 1960s film to today. Reports cover growth rates, the direction of sprawl and the farmland or green space each city absorbed.
Built-up footprints per epoch
Growth-rate statistics
Sprawl & density maps
02 / DEFORESTATION
Prove what was forest, and when it changed.
Consistent forest and non-forest maps across decades quantify clearing, degradation and regrowth. They also give you the historical baseline needed for EUDR and other supply-chain due diligence.
Forest cover baselines
Loss & regrowth in hectares
Cut-off-date evidence
03 / CHANGE DETECTION
Find exactly what changed, and how much.
Comparing any two dates reveals new roads, construction, mining, reservoirs and land clearing. Each change is classified by type and ranked by size.
Change maps & polygons
Change-type classification
Area & length statistics
04 / LAND-COVER MAPPING
One classification, consistent across every era.
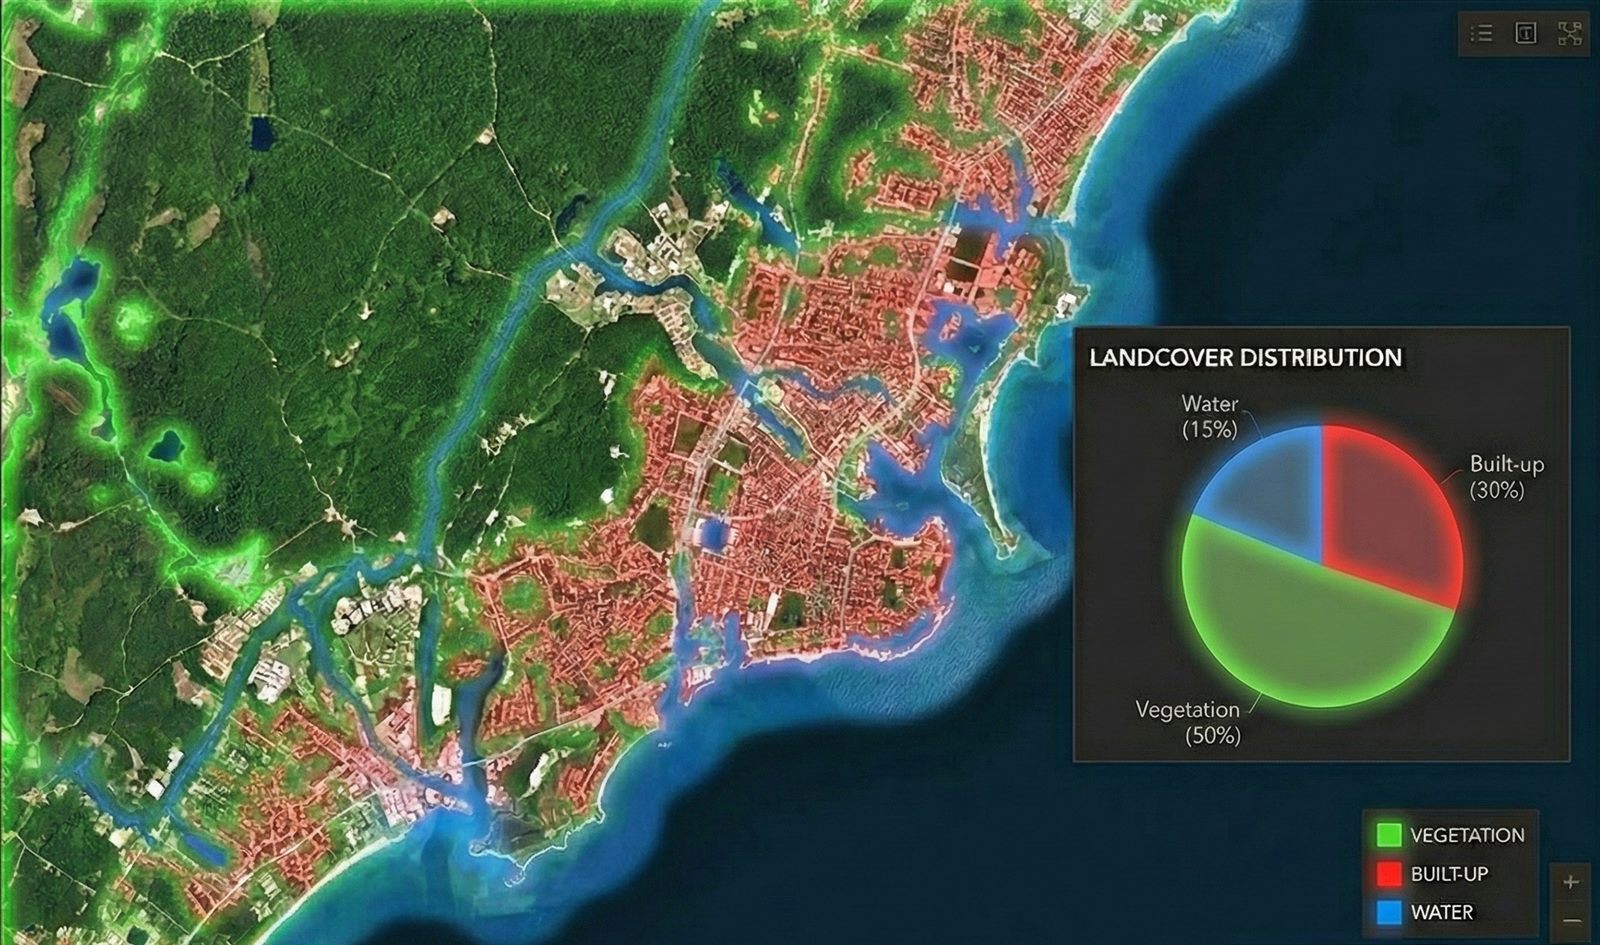
We classify vegetation, built-up land, water and more, harmonised across sensors. That way a 1966 map and a 2025 map can be compared directly.